How to Use Hypergraph
In the pages menu, navigate to Advanced Analytics > Hypergraph. Any applied queries are retained when you switch to or from the Hypergraph page.
- Hypergraph dashboard
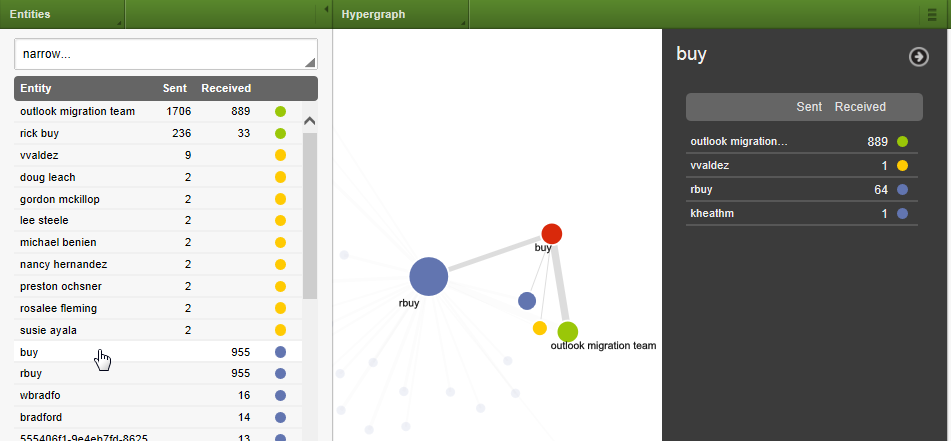
- The main Hypergraph dashboard visually displays entities (communicating parties) with color-coded circles. The colors are defined by a legend.
-

- The size of the circles visualizes the volume of information they represent within the current result set (not the whole data set). The lines represent the communication between the entities. The thickness of the lines visualizes the volume of exchanged data.
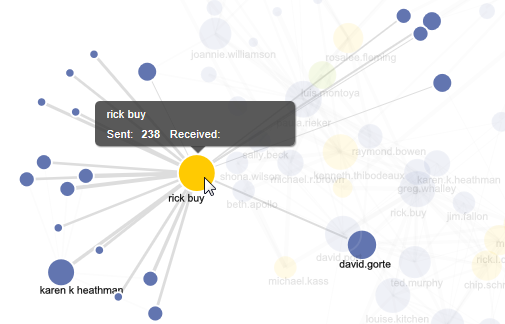
- Hover your mouse on a circle to learn the name of an entity and their total sent and received message counts; that entity’s communication network is also pulled to the forefront.

- Hover your mouse on a line to see the names of the entities associated with that path of communication and the total number of messages those specific entities exchanged.
-

- Entities panel
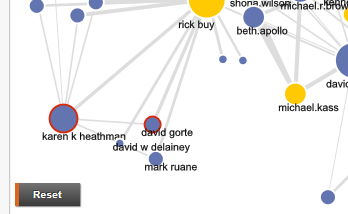
- The Entities panel lists each entity displayed in the current Hypergraph view, sorted by number of sent and then received communications, in descending order. To see an entity’s location in the graph, hover on an entity name in the Entities panel. When it turns red, you see its representation in the graph.
- Locate an entity
- To locate an entity without changing the result set, use the keyword search box at the top of the Entities panel. It incrementally filters the list of displayed entities.
-

- Connection Details
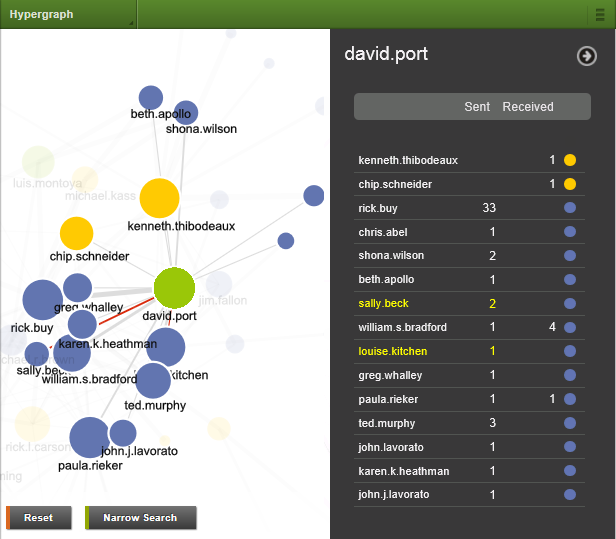
- Click an entity name in the Entities panel or double-click an entity in the graph and that entity’s connection details fly-in opens. The top of the fly-in confirms the selected entity’s name.
- The fly-in lists the entities that the selected entity was in communication with and shows the number of exchanged messages. The Sent column means the selected entity sent to the listed person; the Received column means the selected entity received messages from the listed person.
-

- Click the name of an entity to select the connection with it. Selected connections are highlighted in yellow in the fly-in. They are highlighted in red on the dashboard. Reset deselects any connections.
- Select and filter to specific entities
- Narrow the graph to particular lines of communication by selecting names on the fly-in panel or selecting lines or nodes (circles) directly within the graph. Selected entities are outlined in red. Click the Narrow Search button to narrow Hypergraph to the selected connections. The restriction is shown as a search criterion in the Current Criteria panel.
- After narrowing to a selected communication, more lines of communication may be seen. Use the Entities panel to quickly see a list of the other entities that were also part of the selected communication exchange.

- Review documents found by Hypergraph
- To review the communications displayed in the Hypergraph, use the pages menu and switch to Analysis or Review. Use the Viewer to view the documents or use the Search panel to layer on additional criteria.
By default the top 25 sender domains and top 100 recipient domains are displayed. Options to adjust these settings are located on the Hypergraph toolbar. Use the Content menu to display To, CC, or BCC field options. Use the Advanced menu to adjust the number of nodes displayed. Up to 1,000 nodes are possible.
Note: The higher the number, the longer the graph will take to load and it can become difficult to explore and read.
Changes to these settings are global for your user account and the settings will be in effect across all of your projects until changed.

When lines of communication overlap or you wish to move an entity to a different location, grab a node by left-clicking it with your mouse and dragging it away from other communication lines. You can also select multiple entities and then drag them as a group.
Left-click in a white-space area of the Hypergraph and drag the window if portions of the graph cannot be seen.
You can zoom in and out to better view the displayed data using the mouse scroll wheel. The zoom function is centered on the location of the mouse point.
Right-click any entity to open the context menu with options to show details or to select, deselect or hide connected or non-connected entities to get a better look at those that remain. Click the Reset button to unhide hidden entities.
Deselect a single selected entity with another click. Deselect all entities by clicking the Reset button.