Analysis Page Introduction
The Analysis page is the main page to browse and analyze documents that have been published to a matter. To get you started and help you navigate, each component of the page is briefly introduced here.
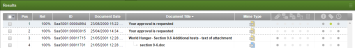
- Results list
- The center-top panel is the Results list where each document in the matter is represented by one row in the list, unless search or filter criteria have been applied. The row for the current selected document is highlighted. Click on any document with your mouse to select that document.
- Results list paging
- The bottom of the Results list displays the number of documents in the list and arrows allow you to move to the next or previous page of the list. To jump to a specific page, input a page number in the page text box and press [Enter] on your keyboard.
-

- Results list columns
- Columns of the Results list display limited document metadata. To change the order of the columns, click on a column header and then drag and drop it to the preferred location. To add or remove columns, click the Columns option in the panel header toolbar and make your selections.

- Results list sorting
- Group by family is active by default. This setting maintains family groupings regardless of whether you change the Results list sort order.
- To change the sort order of the Results list, click a column header to quick sort or use the Group/Sort options on the toolbar to set a multi-level sort of up to three levels. Documents with the same value in the first sort field are sorted by the field selected in the second row. Likewise for the third row.

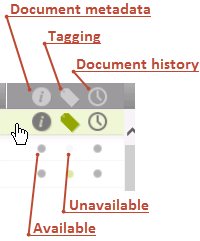
- Document Information Columns
- Visualization panel
- The Visualization panel graphically displays Smart Filter values and their document counts. Only values that pertain to the documents currently displayed in the Results list are visualized. To minimize the Visualization panel, click the down arrow at the far right of the panel; to maximize it click the up arrow twice.

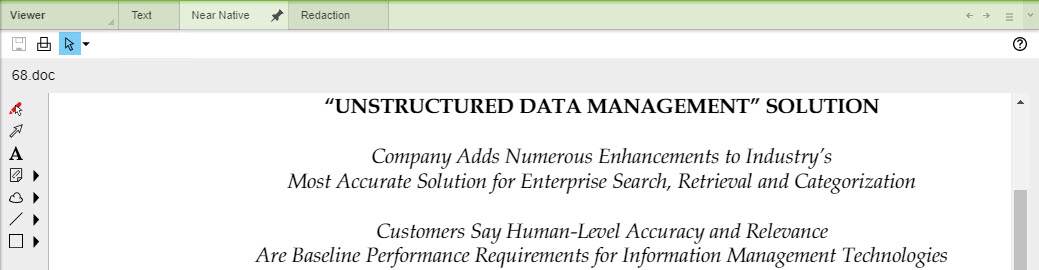
- Viewer
- The document currently selected in the Results list displays in the Viewer panel when you switch the Visualization panel to Viewer using the drop-down list.
-

- You can also click on a document title in the Results list to auto-open and auto-expand the Viewer.
- Tagging panel
- The right-hand pane is used to tag documents, one-by-one or in bulk. Select the Results list check box for a document to activate the Tagging panel.
-

- Discussion, Foldering, Review Workflow, and Production Workflow panels
- Click in the green Tagging panel header to access the Discussion, Foldering, Review Workflow, and Production Workflow panels. You use the Discussion panel to exchange comments with other users, the Foldering panel to organize documents, the Review Workflow panel to add documents to a review workflow, and the Production Workflow panel to add documents to a production workflow.
-

- Search panel
- The top, left-hand pane provides access to search and Smart Filter functionality.

- Current Criteria panel
- The bottom left-hand pane displays applied search and Smart Filter criteria. Hover your mouse on an applied search or filter to see lock, edit and remove options. Click the up arrow on the right side of the panel to see applied criteria details for complex queries without scrolling.
-

- Two-Screen Mode
- By default, the Viewer is located under the Visualization panel. Activate two-screen mode to open the Viewer in a separate screen. To activate two-screen mode, click and select Analysis (2-Screen) in the application header.

Allow pop-up blockers from Axcelerate 5 to utilize two-screen mode.
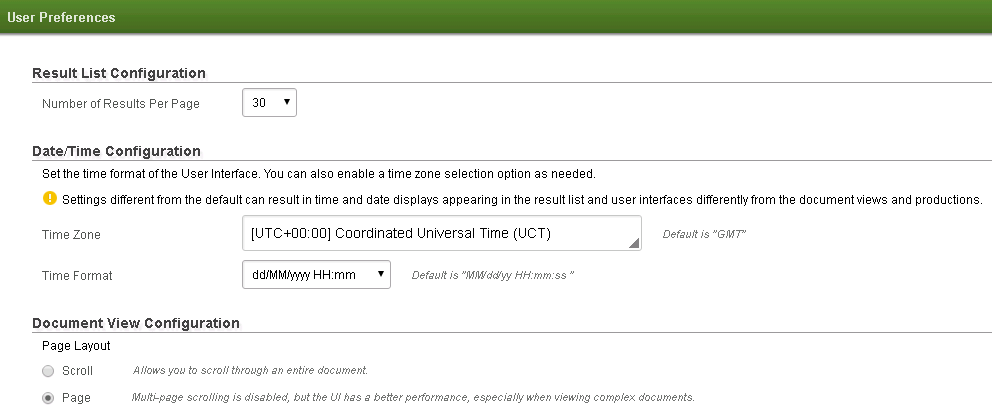
- User Menu
- The user menu allows you to access the
Preferences page and to log out.
Click on your user name in the upper right of the window to see the options.
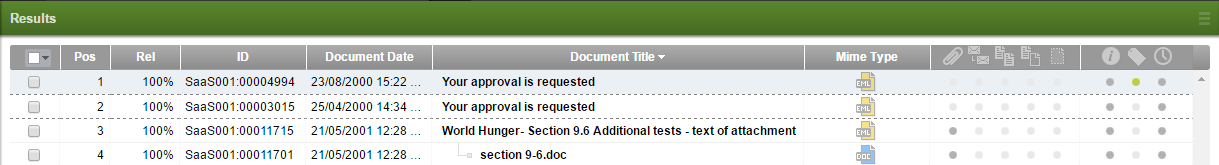


The right-most area of the Results list contains document information icons. The metadata icon opens the metadata fly-in. The tagging icon is a visual indicator of whether a document has been tagged. The document history icon opens the document history view.